Climate Change Effects: Massive Ice Wave Cut Through Rink Glacier [VIDEO]

Greenland’s Rink Glacier is not just melting faster than usual: The hot summers of 2010 and 2012 saw the interior of the glacier sliding like a popsicle coming out of its wrapper, a NASA study found.
The study found the ice wave lasted four months, with mass from upstream replacing whatever was lost at the bottom due to warming. NASA said this solitary wave has implications for the future rate of sea level rise.
The findings were published in the journal Geophysical Research Letters.
Read: US Should Stay In Paris Accord, Perry Says
Scientists at NASA’s Jet Propulsion Laboratory in Pasadena, California, used a GPS sensor for the study, measuring its horizontal motion as the ice melted. There is a network of 50 GPS stations on Greenland that track changes below the earth’s surface by measuring vertical motions. The study by the three scientists is the first to try to measure the changes horizontally as well.
Greenland drained about 11 billion tons of ice per year in the early 2000s. In 2012, which was unusually hot, the output increased by more than 60 percent to 17.7 gigatons. That additional 6.7 gigatons was in the form of a single wave from June through September. In the first three months, the wave traveled 2.5 miles. That increased to 7.5 miles in September.
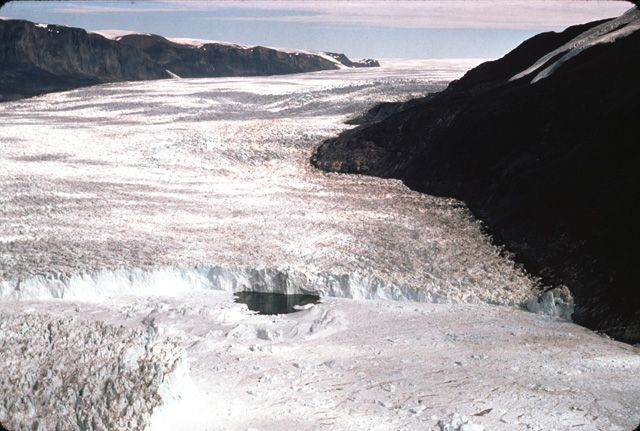
The glacier held a record amount of water that year with more than 95 percent of the surface snow and ice melting, NASA said. Meltwater forms temporary lakes that eventually drain into the ocean. As the water created drainage channels, it began to flow more quickly.
Read: EPA Administrator Pruitt Admits Humans Contribute To Global Warming
JPL scientist Eric Larour, who co-authored the paper, said the usual methods of measuring ice melt missed the slide completely.
"You could literally be standing there and you would not see any indication of the wave," he said. "You would not see cracks or other unique surface features."
The same pattern was detected in 2010, which was just slightly cooler than 2012. But that summer’s wave was not nearly as large as the one in 2012 though it was similar.
"We know for sure that the triggering mechanism was the surface melting of snow and ice, but we do not fully understand the complex array of processes that generate solitary waves," study leader Surendra Adhikari said.
From October through January, ice continued to move downstream in a systematic transport system not previously recognized, Adhikari said.
"Intense melting such as we saw in 2010 and 2012 is without precedent, but it represents the kind of behavior that we might expect in the future in a warming climate," co-author Erik Ivins added. "We're seeing an evolving system."
The National Oceanic and Atmospheric Administration reported 2016 was the warmest year on record and already in 2017, monthly records have been set. Temperatures in the Arctic ran as much as 30 degrees above normal during the fall as a result of El Nino.
India recorded its hottest day in history on May 19, 2016, at 123.8 degrees.
The warming also has played havoc in the Antarctic where a crack in the Larsen C ice shelf is threatening to calve a massive iceberg.
© Copyright IBTimes 2026. All rights reserved.
- MOST POPULAR IN Technology