

NASA Aerial Photos Of California Fires Show Damage, Help First Responders
NASA is using the same technology it used to help map the aftermath of the earthquake that shook Mexico last month to map the damage cause by the wildfires in California. The agency’s Advanced Rapid Imaging and Analysis team at the Jet Propulsion Laboratory and at California Institute of Technology have been creating damage proxy maps after disasters to aid in the recovery effort.
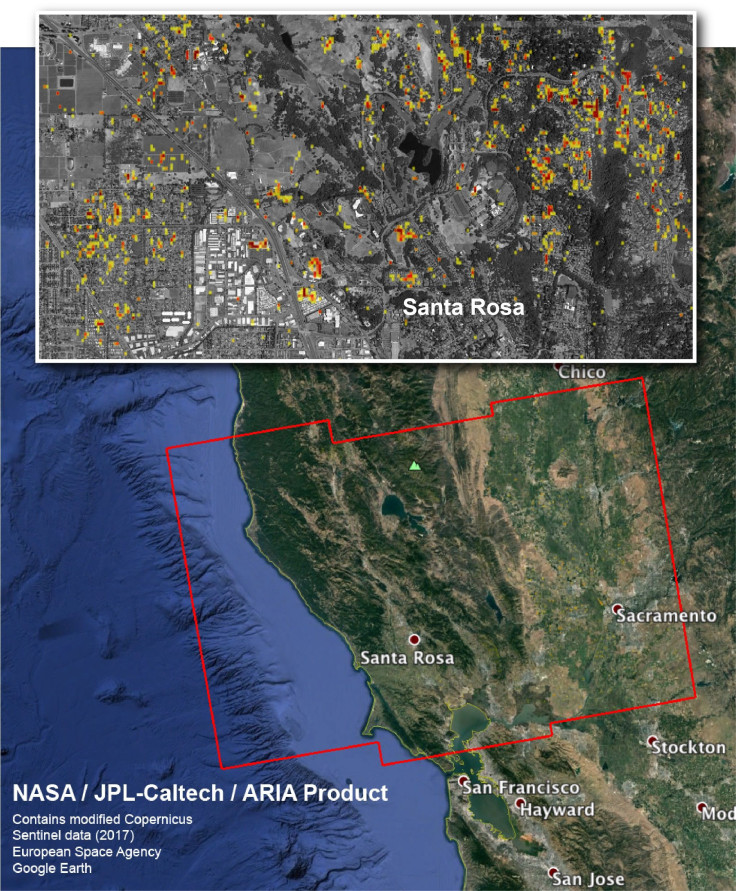
The most recent map shows before and after imaging of Northern California areas impacted by the wildfire ripping through the state. The photos that make up the map are made of images taken from synthetic aperture radar or SAR. The images were taken in the months prior to the fire from the Copernicus Sentinel- 1 satellites that the European Space Agency operates. The specific photos used for the map was taken on Sept. 27 and then on Oct. 9 after the fire, both at 7 p.m. PDT.
The map covers an area of 155 miles by 106 miles in California with the lower bounds of it just above San Francisco. The example shows a detailed map of Santa Rosa with red and yellow pixels indicating where the damage is. The more red the color is the worse the damage in that area was, with red representing the most damage. This data was made available to authorities to use in response and recovery efforts.
The team is developing this system so that one day it might be able to make these proxy maps for disasters automatically, almost immediately after disaster strikes. That way they could be used by response teams looking to assess infrastructure before entering a potentially dangerous area after a disaster. Eventually the hope is that this system would work on a local, national and international level.
The radar is special in that it can measure through clouds meaning it can be used at any time of day and in any weather for rapid data collection and map production. “As populations grow, response to natural disasters is becoming an increasingly important part of link between science and society,” says the project’s website. With the addition of the new tools the teams are working on, “We anticipate the improvement of situational awareness immediately following disasters,” the site says.
The team assesses the process and the aftermath of earthquakes, volcanoes, landslides fires, and recently hurricanes to help with the response efforts afterwards. For each disaster it shows something slightly different. Like for hurricanes the map shows where the worst flooding is while for the fire damage map it showed the most change in landscape and the damage done there.
© Copyright IBTimes 2025. All rights reserved.
- MOST POPULAR IN Technology


