Bitcoin Price Analysis: Bulls Remain Elusive; Analyst Sees Four-Year Cycle Extending
KEY POINTS
- Bitcoin continue to hover below $50,000
- The fear and greed index shows extreme fear in the market
- Analyst suggests BTC market cycle will lengthen
Bitcoin dropped below $50,000 on Saturday as feared by many analysts. The king of cryptocurrencies dropped to $42,000 before quickly rebounding to $48,000.
The fear and greed index of Bitcoin, released by Alternative.me, shows the market sentiment for the cryptocurrency is "extreme fear," and traders are panic selling. For times like these, Warren Buffet once stated, "Be fearful when others are greedy, and greedy when others are fearful."
Data from CoinMarketCap shows that Bitcoin dropped by nearly 1.34% in the past 24 hours, reducing the market capitalization of the token to $911 billion. As of 4:23 a.m., BTC's dominance dropped to 40.86% due to the fall of market cap below $1 trillion.
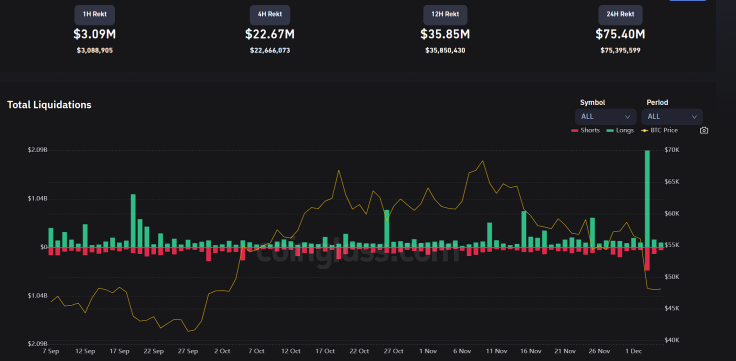
The coin's price reached a daily high of $49,438 Monday, before falling to a daily low of $47,730. The liquidation data from CoinGlass shows that $2.09 billion BTC longs were liquidated on Saturday.
Bitcoin price anlaysis
Bitcoin analysis on the daily chart below shows a bearish scenario for the cryptocurrency. The prices broke down from the lower end of the Bollinger Bands after multiple bearish red candles on the daily chart. The 50-day and 100-day moving averages continue to act as the resistance after prices fall below these key averages.
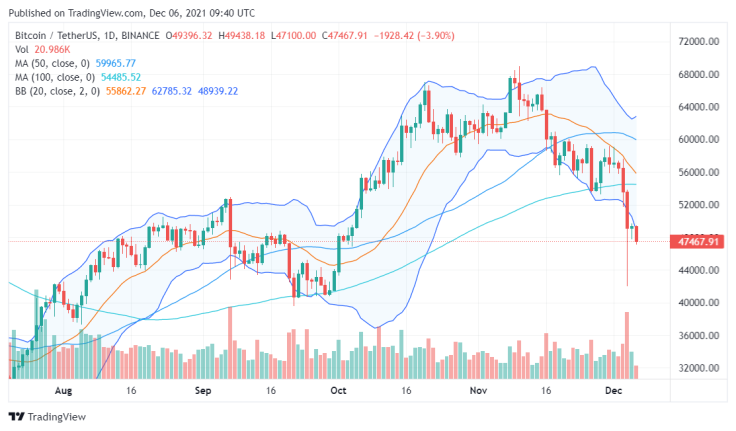
The chart below shows that the bullish divergence was prevented in the chart below when the signal line (orange) failed to break above the MACD line (blue). This was unexpected and led to the continuation of the bearish retracement. The intensity of bars of the MACD histogram also suggests that Bitcoin will continue to remain bearish.
The RSI indicator shows that Bitcoin entered the oversold zone, dropping below 30. The gradient of the line is sharply negative, indicating that the selling orders are being placed by traders in greater numerical strength as compared to the buying orders. As of now, BTC is 30.88% low from its all-time high at $69,000.

Bullish journey lies ahead
According to analysts, Bitcoin has carved a bullish path ahead of it. Popular trader and trading algo developer Kong Trading said that they see a 15% pump for Bitcoin today. While this is a bullish analysis, prices are rather bearish for BTC.
There will be no bears left to hunt by the end of this year!!!
— Kong Trading 🦍 (@KongBTC) December 6, 2021
WE GOING UP AGAIN🚀🚀🚀
On the other hand, Lark Davis, a popular analyst and Ethereum supporter said lower prices in the short term are definitely possible and more likely to happen.
"I am an unapologetic unrelenting #bitcoin and #crypto bull. This market is literally the single greatest wealth creation opportunity for you in your lifetime. That being said, we could still be going lower short term," said Davis.
He also claims that the Bitcoin cycle is getting longer. Historically speaking, every Bitcoin halving is followed by a bull market while preceded by a bear market. However, Davis claims that this time, the BTC bull cycle is lengthening and also, investors "probably won't see a top until well into 2022."
I personally welcome this reaccumulation phase before the next big move up. #bitcoin
— Lark Davis (@TheCryptoLark) December 5, 2021
Benjamin Cowen, analyst and CEO of "Into the Cryptoverse," said that the last four-year Bitcoin cycle ended in 2019. "It makes absolutely no sense to assume that Bitcoin will repeat itself exactly every four years, he added.
As I have said since 2019, the only “four year cycle” for #Bitcoin was the last one.
— Benjamin Cowen (@intocryptoverse) December 6, 2021
It makes absolutely no sense to assume that Bitcoin will repeat itself exactly every 4 years
International Business Times holds no liability for any investments made based on the information provided on this page. We strongly recommend independent research and/or consultation with a qualified professional before making any investment decisions.
Parth Dubey holds Bitcoin (BTC), Ethereum (ETH), Solana (SOL), Cardano (ADA) and Polygon (MATIC).
© Copyright IBTimes 2025. All rights reserved.
- MOST POPULAR IN BTC