

NASA’s Juno Shows Jupiter’s North Pole And Its Cyclones In Infrared 3D
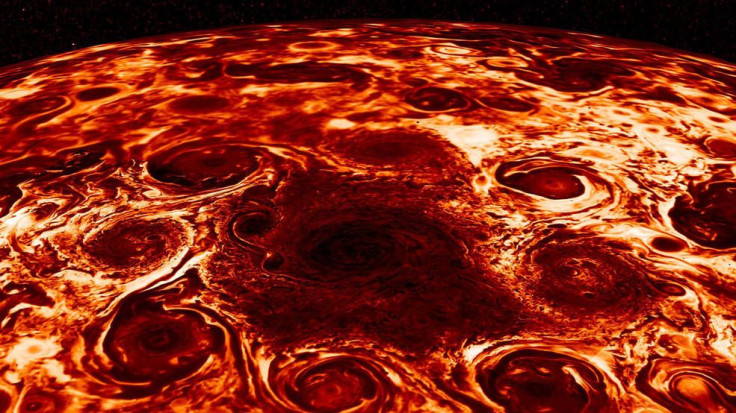
NASA scientists working on the space agency’s Juno mission to Jupiter have taken data from the spacecraft’s Jovian Infrared Auroral Mapper (JIRAM) instrument and put together an animation that shows the gas giant’s north pole and the nine cyclones that populate the region. The three-dimensional animation makes a low sweep over the planet’s polar region, and shows the contours of the cyclones in infrared.
In the video, the yellow areas are warmer and deeper inside Jupiter’s atmosphere, while the darker parts are colder and higher up in the atmosphere. In this animation, the maximum temperature difference is of about 70 degrees Celsius. The data for the animation was collected during Juno’s fourth pass over the planet.
“Before Juno, we could only guess what Jupiter’s poles would look like. Now, with Juno flying over the poles at a close distance it permits the collection of infrared imagery on Jupiter’s polar weather patterns and its massive cyclones in unprecedented spatial resolution,” Alberto Adriani, Juno co-investigator from the Institute for Space Astrophysics and Planetology, Rome, said in a statement Wednesday.
The JIRAM instrument probes the layers of Jupiter’s atmosphere between 30 and 45 miles (50 and 70 kilometers) below the planet’s cloud tops. Of the nine cyclones on the Jovian north pole, one is in the center, and eight other cyclones and anticyclones surround the central one. Bigger than any storms on Earth (but not the biggest on Jupiter), these cyclones range from 4,000 to 4,600 kilometers (2,500 to 2,900 miles) in diameter.
Another animation, also released Wednesday, shows an infrared flyover of Jupiter’s north pole.
Data gathered by Juno also allowed scientists to better understand Jupiter’s magnetic field and the dynamo that powers it. They put together a planet-scale map of the dynamo and magnetic field lines that showed “unexpected irregularities, regions of surprising magnetic field intensity, and that Jupiter’s magnetic field is more complex in the northern hemisphere than in the southern hemisphere. About halfway between the equator and the north pole lies an area where the magnetic field is intense and positive. It is flanked by areas that are less intense and negative. In the southern hemisphere, however, the magnetic field is consistently negative, becoming more and more intense from the equator to the pole.”
The dynamo map was also released as an animation. In it, regions in red are where magnetic field lines emerge from, while the areas in blue are where the lines return to.
“We’re finding that Jupiter’s magnetic field is unlike anything previously imagined. Juno’s investigations of the magnetic environment at Jupiter represent the beginning of a new era in the studies of planetary dynamos,” Jack Connerney of the Space Research Corporation, Annapolis, Maryland, who is deputy-principal investigator of the Juno mission, said in the statement.
Juno has been in orbit around Jupiter since July 4, 2016, and has made 11 passes since. The 12th scientific pass is scheduled for May 24.
© Copyright IBTimes 2025. All rights reserved.
- MOST POPULAR IN Technology


