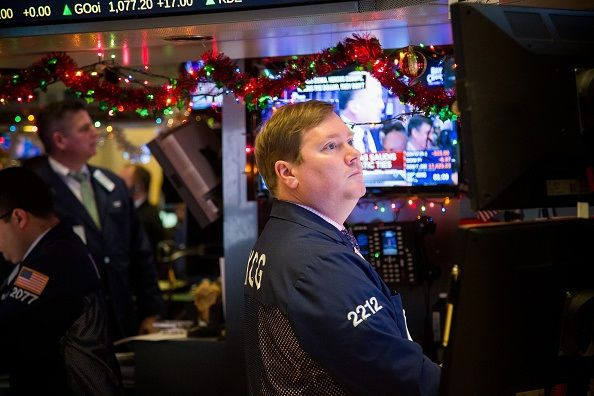
Dow Plunges With Worst Opening Day Since 2008: Is January Barometer, Santa Rally Real?

Investors were not happy Monday as the Dow Jones Industrial Average plunged 274 points, or 1.57 percent, on the first day of trading of 2016. Earlier in the day, the Dow was down more than 400 points, which put it on pace for the largest percent decline on a year's first day of trading since 1932, when the country was in the worst of the Great Depression.
While the markets recovered some before closing Monday, the opening does not bode well for the rest of the year. The Standard & Poor 500 index closed down 31 points, or 1.51 percent, Monday and the Nasdaq dropped 104 points, or 2.09 percent. The final numbers made Monday the worst start to the year for the Dow since 2008, and the worst start for the S&P and Nasdaq since 2001, Reuters reported.
Typically, Wall Street sees a period of gains over the holiday season. The last five trading days of the year plus the first two trading days of the new year have historically brought what is known as a “Santa Claus Rally,” Money.com reported. Since 1969, the S&P 500 index of U.S. stocks has averaged 1.4 percent gains during this period.
While these gains can make investors feel happy in the short term, the impact is felt more significantly when markets do not experience this uptick — as is happening this time. The markets still have one more day to salvage the 2016 “Santa Rally” window, but so far things are not looking great.
Other years that have experienced poor performances over the holidays have also seen negative market trends the rest of the year. After lackluster market performances at the end of 1999 and 2007, for example, the S&P lost 9 percent in 2000 and 37 percent in 2008. Other years have followed this pattern as well, Money.com pointed out. Recent examples include 1994, 2005 and 2015, when the S&P 500 tumbled 0.7 percent, making that the worst year since the financial crisis ended in 2009.
Beyond the “Santa Rally” theory, many traders were probably thinking of the popular axiom “as January goes, so goes the year” when they watched market activity Monday. This usually refers to the market trend over the whole month of January, but analysts can get an idea of how January might play out from its first few days.
U.S. stocks plunge at open; Dow Jones down more than 300 points https://t.co/yo9BALLRYX pic.twitter.com/JavJzcVH6T
— Bloomberg TV (@BloombergTV) January 4, 2016The idea of the January Barometer was introduced in 1972, Forbes reported. From 1950 to 1984, if the month of January saw positive returns, those were predictive for a positive year with 90 percent probability. When January saw negative trends, it was predictive of a negative market year 70 percent of the time.
In the years since 1984, market actions have reduced the predictive power of January returns, but economists still say positive market trends in January are good for the year ahead. For the 64 years from 1950 through 2013, gains in January predicted positive returns for the year 92.5 percent of the time. On the other hand, negative January returns predicted a negative year 54.2 percent of the time — so very close to chance.
The large losses in U.S. stocks Monday came after a slide of nearly 7 percent in China’s Shanghai Composite Index due to weak manufacturing data and falling currency, ABC News reported. The plunge forced Chinese officials to suspend trading Monday, which sent a wave of concern through global markets, recalling the slowdown in China last August.
As market analysts look at historical precedent for low opening days, many still caution that investors should not panic. “While investors should be vigilant, it is important not to over-react to market emotion,” David Kelly, chief global strategist for JP Morgan Funds told Money.com. “Always ask if the issue at hand fundamentally alters your view of the business prospects of the companies in which you have invested.”
#USATODAY https://t.co/hAGbIbeIRt Dow at risk of first down year since 2008 as Wall Street fights to get back int… pic.twitter.com/6qkR8CTG9W
— Money News 24h (@MoneyNews24h) December 23, 2015© Copyright IBTimes 2025. All rights reserved.


